Skip to main content What is Dynamics 365? Guided tours Customer stories Try our products Build your own agents CRM ERP Sales Service Sales Customer Insights Customer Service Contact Center Field Service Supply Chain Management Commerce Finance Project Operations Human Resources Business Central Pricing Business application topics Training & certifications Documentation Migrate to the cloud Private equity Migrate to Dynamics 365 Events Dynamics 365 Blog Product updates Onboarding and implementation Community Find a partner Software Development Companies Partner resources Microsoft Marketplace Product documentation Technical support On-premises product support Contact us Try for free Sign in
1 min read

Filtering out blank fields


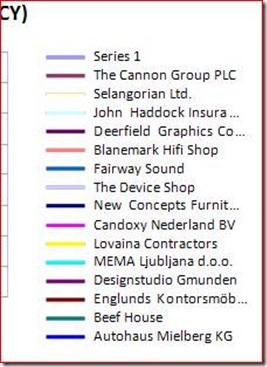
Some of you have noticed that the Chart displayed in “Customer Order – Summary” contained a series label called Series 1.
clip_image002

Well the reason for that being shown is because we have missed to filter out all customer with have no data in the field: Chart_SalesOrderAmountLCY.Value

So how is that actually done? Well let me show you:

  1. Design Report 70000
  2. Select “View / Layout”
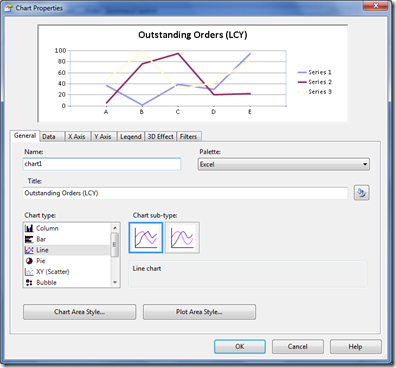
  3. Right click the chart in the bottom of the report
image
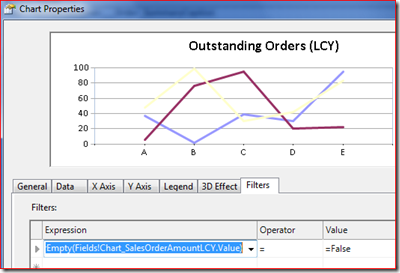
  1. Select “Filters” tab
  2. Type the follow:
Expression:
=System.String.IsNullOrEmpty(Fields!Chart_SalesOrderAmountLCY.Value)

Operator:
=

Value:
=False
image
  1. With this filter we now filter out where “Chart_SalesOrderAmountLCY.Value” is equal blank.
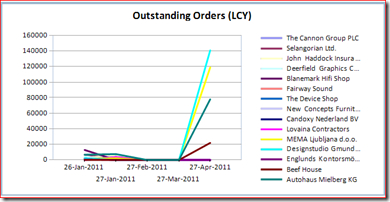
  2. Now save and compile the report and display in RoleTailored client. Now only customers with outstanding orders are shown in the chart.
image

I have updated the demo reports package to reflect this change.

Get started with Dynamics 365

Drive more efficiency, reduce costs, and create a hyperconnected business that links people, data, and processes across your organization—enabling every team to quickly adapt and innovate.